AI‑Powered Visibility Across Livestock and Feed Operations
- AccleroTech

- Mar 30
- 4 min read
Updated: Apr 2

Livestock and feed operations operate in a highly interconnected environment.
Livestock demand fluctuates with market cycles, feed availability depends on crop performance and sourcing stability, and quality must be maintained consistently across plants, regions, and seasons.
Yet in many organizations, these dimensions are still reviewed through disconnected reports and siloed systems.
Sales teams focus on demand, operations teams manage supply, and quality teams track compliance, often without a shared view of how these signals influence one another.
This disconnect is where risk quietly builds.
To manage scale, protect margins, and maintain trust, organizations need connected visibility, a way to see demand pressure, supply readiness, and quality performance together. This is where Livestock & Feed dashboards move from reporting tools to decision enablers.
The Business Challenge: Growth Without Visibility Creates Risk
In livestock and feed operations, growth is often seen as a positive signal-rising demand, expanding production, and broader market reach. However, when this growth is not matched with end‑to‑end visibility, it can quietly introduce risk into the organization.
As livestock demand increases, feed operations are expected to scale quickly. Supply chains become more complex, sourcing spans multiple crops and regions, and production volumes rise across plants.
At the same time, quality expectations remain non‑negotiable, with regulatory compliance and downstream trust depending on consistent standards.
Without a connected view, leaders are left navigating these dynamics through fragmented information:
Sales and demand trends are reviewed independently of supply readiness
Feed production data lacks context on dependency and resilience
Regional performance variations are difficult to compare and prioritize
Quality signals emerge late, often after deviations or failures occur
Teams spend time reconciling reports instead of acting on insights
This fragmentation creates blind spots. Decisions are made with partial context, issues surface only after impact is felt, and corrective actions become reactive rather than preventive.
What begins as growth momentum can quickly translate into operational strain, margin pressure, or compliance exposure.
The real challenge, therefore, is not growth itself-but managing growth without a unified, trusted view of demand, supply, and quality.
Addressing this challenge requires dashboards that connect these dimensions, turning scattered data into shared understanding and enabling leaders to act with confidence rather than hindsight.
Why Livestock & Feed Dashboards Are Needed
Dashboards are not about displaying data—they are about creating shared understanding.
A well‑designed Livestock & Feed dashboard enables leaders to:
See how livestock demand and feed supply evolve together
Understand the composition and resilience of feed inputs
Identify regional pressure points early
Monitor quality trends instead of isolated test results
Align commercial growth with operational and quality readiness
The result is faster, more confident decision‑making across teams.
Dashboard Insights: Page‑by‑Page View (AI‑Powered Visibility Across Livestock and Feed Operations)
To see how these insights come together in practice, watch the demo of the AI‑enabled Livestock & Feed Dashboard in action
The Livestock & Feed dashboard is designed as a connected journey, with each page building on the previous one—moving from demand context to quality outcomes.
Page 1: Feed Sales & Demand Overview
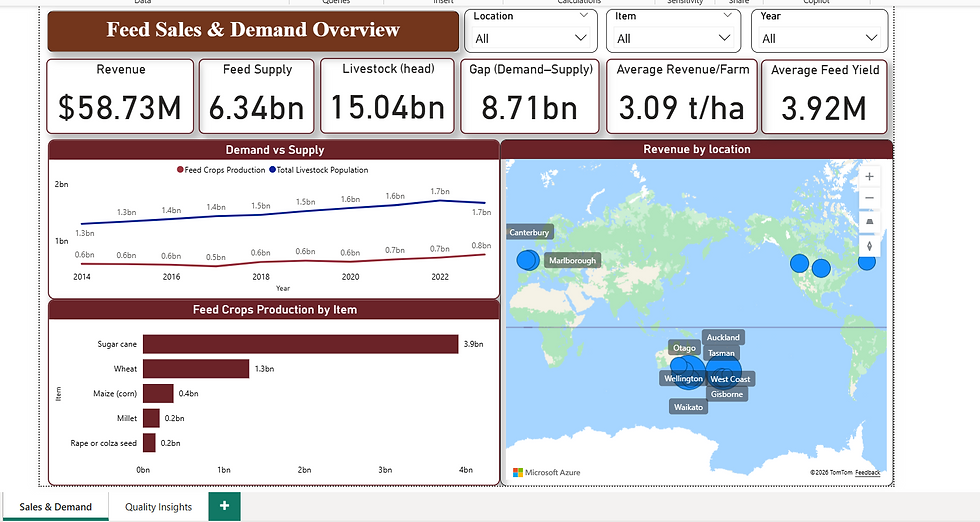
This page establishes the operational and commercial context for livestock and feed decision‑making.
By bringing together feed sales performance, livestock demand patterns, and supply availability, the dashboard allows leaders to understand how these forces interact over time.
Trend‑based views highlight whether demand is stabilizing, accelerating, or beginning to place pressure on available supply—providing early signals that support proactive planning.
The page also helps stakeholders understand what drives feed supply, offering visibility into feed crop composition. This insight supports more informed discussions around sourcing strategies, diversification, and long‑term resilience.
A regional view further strengthens decision‑making by showing how performance varies across locations, helping organizations align logistics, production planning, and operational focus with market demand.
Business impact: Leaders gain a shared, end‑to‑end understanding of demand pressure, supply readiness, and regional dynamics—reducing surprises and improving planning confidence.
Page 2: Quality Insights

As operations scale, quality becomes the anchor that sustains growth.
The Quality Insights page shifts the focus from volume to consistency, providing a consolidated view of feed quality across plants and quality assurance processes.
Instead of reviewing individual test results in isolation, leaders can quickly assess whether quality is stable, trending, or beginning to show early signs of risk.
Trend‑based views are central to this page. By tracking quality indicators over time, the dashboard reveals variability and emerging patterns that may point to upstream issues such as raw material changes, seasonal effects, or process execution gaps.
This enables early intervention-before quality issues escalate into compliance concerns or downstream impact.
The page also introduces transparency across QA labs and plants, helping teams identify where performance is consistent and where focused improvement is required.
This supports targeted action rather than broad, reactive measures.
Business impact: Organizations move from reactive quality management to proactive risk prevention—protecting compliance, operational efficiency, and trust.
Connecting Demand, Supply, and Quality
Individually, each dashboard page answers a specific question.
Together, they tell a complete operational story:
Demand visibility informs supply planning
Supply composition highlights resilience and risk
Regional insights guide operational focus
Quality trends enable early intervention
QA transparency drives continuous improvement
This integrated approach ensures that growth decisions remain aligned with operational capability and quality governance.
From Visibility to Business Outcomes
(AI‑Powered Visibility Across Livestock and Feed Operations)
The true value of the Livestock & Feed dashboard lies in the outcomes it enables:
Anticipating demand–supply imbalances before they impact operations
Strengthening feed supply foundations through informed sourcing decisions
Detecting quality risks early through trend‑based monitoring
Aligning commercial ambition with operational and quality readiness
In an environment where margins are tight and expectations are high; leaders need more than fragmented insights. By connecting livestock demand, feed supply, and quality performance into a single, intuitive experience, organizations turn complexity into clarity-and data into confident decisions.
About AccleroTech
AccleroTech specializes in building AI‑first, reuse‑first analytics solutions that help organizations move from hindsight to foresight-without disrupting core systems.
With 160+ reusable solutions, AccleroTech accelerates time to value by combining:
AI‑first architecture for predictive and prescriptive insights
Clean‑core, sidecar‑based analytics that avoid over‑customizing ERP platforms
Microsoft Power BI and the Power Platform for scalable, secure enterprise analytics
Whether addressing demand–supply imbalances, detecting quality risks early, or providing transparent insights across livestock and feed operations, AccleroTech delivers solutions that align operational clarity, trust, and agility.
For more details, contact us at


Comments