From Orchard to Outcome: AI‑Enabled Dashboards for Seasonal Visibility
- AccleroTech

- Mar 19
- 4 min read
Updated: Apr 2
The global kiwifruit industry is under pressure like never before.
Growers are dealing with climate volatility, exporters are navigating longer and riskier supply chains, and marketers are expected to deliver consistent quality and returns across a highly seasonal, biology‑driven business.
For grower‑owned organizations such as Zespri, these challenges come with an added responsibility: ensuring fairness, transparency, and confidence for every grower, not just market success.
In this context, fragmented reports and backward‑looking spreadsheets are no longer enough. What’s needed is a connected, insight‑driven view of the entire season-from orchard to market.
This blog walks through a two‑page Power BI dashboard designed for the kiwifruit industry, illustrating how modern analytics helps answer three critical business questions:
How is the kiwi season tracking right now?
What risks and opportunities are emerging early?
Are growers being rewarded fairly and transparently?
Business Context: Why Seasonal Visibility Matters in Kiwifruit
The kiwifruit industry operates within a tightly constrained seasonal window, where biological limits, logistics complexity, and market expectations must align precisely.
Success depends not just on execution, but on timely visibility across the entire value chain.
Key realities shaping the kiwifruit business:
Harvest timing is biologically fixed and cannot be shifted
Fruit quality develops within narrow, time-sensitive windows
Shelf life begins declining immediately after harvest
Export journeys span multiple weeks across global routes
Climate variability increasingly disrupts harvest planning
Labor availability is constrained during peak harvest periods
Logistics and cold-chain costs continue to rise
Retailers expect consistent, year-round availability
Growers expect clear, fair, and transparent returns
Why visibility during the season is critical (AI‑Enabled Dashboards for Seasonal Visibility)
In the kiwifruit industry, timing directly determines value. Issues identified too late, whether slower harvest progress, quality variation, or shelf-life pressure—cannot be fully corrected through downstream actions.
When in-season visibility is limited, organizations are forced into reactive decision making, often after key outcomes are already set. This leads to inefficiencies, missed opportunities, and misalignment across stakeholders.
By contrast, strong seasonal visibility enables:
Early identification of risks and deviations
Realistic management of uncertainty
Timely coordination across growers, operations, and markets
It transforms the season from reactive firefighting into proactive, controlled execution, where decisions are made while there is still time to influence outcomes.
This is the critical business gap the dashboard is designed to address.
Dashboard Overview (AI‑Enabled Dashboards for Seasonal Visibility)
Visibility is the foundation of effective decision‑making. By bringing critical information together in a clear and timely manner, dashboards enable teams to understand what is happening, why it matters, and what needs attention next.
To see these dashboards in action, watch the short demo video that walks through both the season‑level and grower‑level views in detail.
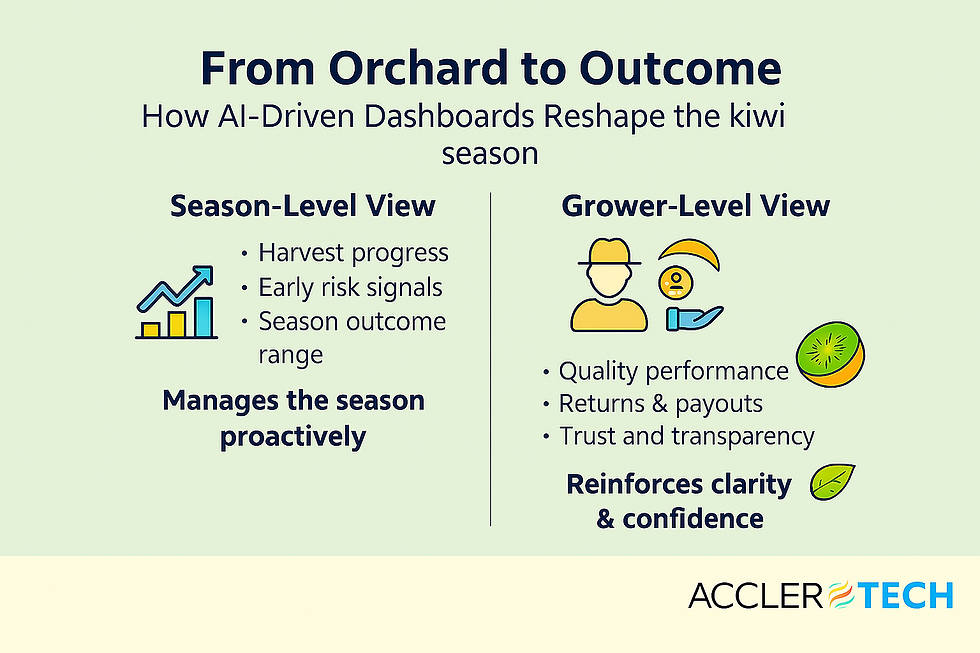
Dashboard 1: How the Kiwi Season Is Tracking

This dashboard provides a season‑level operational view of how the harvest is unfolding against plan. It brings together harvest progress, expected season outcome, geographic contribution, and early operational risk into a single, coherent picture.
High‑level KPIs summarize harvest progress, plan alignment, export value, and average returns, while supporting visuals show how the season is progressing over time, where fruit is coming from, the likely range of season outcomes, and early shelf‑life risks.
Usage: This page is used by operations and leadership teams as a regular in‑season check‑in. It helps identify drift early, acknowledges uncertainty instead of hiding it, and supports timely decisions around logistics, storage, and market allocation, before options disappear.
Dashboard 2: Grower Performance & Settlement

This dashboard shifts focus from season execution to grower outcomes, showing how volume and quality translate into financial returns and how those outcomes are distributed across growers and across the season.
KPIs highlight total supply, average returns, total payout value, and top‑grade contribution, while visuals connect quality performance to returns, place grower outcomes in context, show seasonal quality patterns, and provide settlement‑level transparency.
Usage: This page supports grower engagement, settlement discussions, and internal governance by making outcomes clear, explainable, and defensible.
It replaces subjective interpretation with shared facts, helping reinforce trust and confidence in the fairness of the system.
How the Dashboard Helps Address Industry Challenges
This two‑page dashboard directly tackles the core challenges facing the kiwifruit industry:
Late discovery of problems → Early visibility into harvest pace, quality shifts, and shelf‑life pressure
Managing biological uncertainty → Scenario‑aware views that show likely ranges, not false precision
Grower trust and transparency → Clear linkage between contribution, quality, and returns
Siloed decision‑making → A shared version of the truth across growers, operations, and markets
Instead of explaining outcomes after the season ends, teams can now manage the season as it unfolds.
In an industry where timing, quality, and confidence define success, this combination turns data from a reporting artefact into a strategic capability.
Final Thought
Kiwi seasons rarely fail suddenly-they drift off course quietly.
By combining early seasonal visibility with transparent grower outcomes, this dashboard empowers organizations to act sooner, explain outcomes better, and strengthen confidence across the entire value chain.
The current dashboards represent a starting point rather than an endpoint. The same data foundation can enable deeper insights across regions, markets, quality trends, and forward‑looking scenarios as business needs mature. That is how data truly reshapes the kiwi season—from orchard to outcome.
How AccleroTech Can Help
AccleroTech specializes in building AI‑first, reuse‑first analytics solutions that help organizations move from hindsight to foresight—without disrupting core systems.
With 160+ reusable solutions, AccleroTech accelerates time to value by combining:
AI‑first architecture for predictive and prescriptive insights
Clean‑core, sidecar‑based analytics that avoid over‑customizing ERP platforms
Microsoft Power BI and the Power Platform for scalable, secure enterprise analytics
Whether enabling in‑season visibility, improving risk detection, or delivering transparent performance and settlement insights, AccleroTech focuses on solutions that align operational clarity, trust, and agility.
For more information, contact us at


Comments